For each basketball game, a team’s performance metrics are measured through various tallies, and one of those metrics is offensive rebounds.
After a missed shot, an offensive rebound gives a team another opportunity to score against its opponent. So when a team records a high number of offensive rebounds in a game, then the team had more opportunities to score, and therefore it had a great game, right?
To examine this, I delved into what I know best: data analysis. I used regular and playoff NBA games data from 1995 to 2016 season to see if offensive rebound was a good metric to measure a team’s game performance.
Specifically, I wanted to know if having a high number of offensive rebounds indicated a great team performance.
The result was unexpected.
| Years | Avg. # of Offensive Rebs in Games Lost | Avg. # of Offensive Rebs in Games Won |
|---|---|---|
| 1995 – 2016 | 11.72609 | 11.34216 |
So what’s going on here? The data indicated that when teams won games, they recorded lower number of offensive rebounds on average. And this fact was true year-over-year. Why would having more opportunities to score be a bad thing for teams?
But first, I had to make sure that such difference in the average number of offensive rebounds between games won and games lost was statistically significant. Even though I had a fairly large sample size (of over 50,000), I wanted to make sure that the difference wasn’t just some fluke in the data. An independent t-test confirmed what I knew to be true: that the difference in the means was statistically significant.
Hmm…
I wondered how the number of offensive rebounds would correlate with the number of points scored so I proceeded to perform some correlation analysis. It surprised me to see that the number of offensive rebounds NEGATIVELY correlated with the number points scored during games!
Though the correlation coefficient was very small (-0.01), the coefficient was statistically significant. That meant the more a team accrued offensive rebounds, the fewer points the team scored. It was totally counter-intuitive to what I knew to be true.
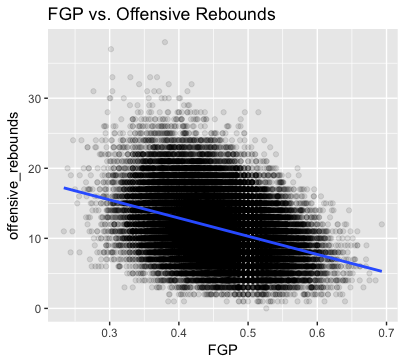
Fortunately, this all made sense when I plotted the relationship between offensive rebounds and field goal percentage.

The x-axis represents the field goal percentage (FGP) metric. The y-axis represents the offensive rebounds. Each individual dot is taken from a single game.
The plot shows that the lower the field goal percentage, the higher the offensive rebounds. The correlation coefficient for this relationship was -0.36. What does that mean?
That meant that during games, in which teams displayed low field goal percentages (where they missed a lot of their shots), the teams had more opportunities to obtain offensive rebounds.
Whereas, during games, in which teams displayed high field goal percentages (where they didn’t miss a lot of their shots), there were fewer opportunities to obtain offensive rebounds because more of the shots went in than missed.
In a very exaggerated hypothetical example, if a team made ALL of its shots and never missed, then the team would record 0 offensive rebounds because there would be no opportunity for an offensive rebound.
In hindsight, it made a lot of sense. Nothing novel going on here. However, it was my pre-conceived notion that first led me to believe that offensive rebounds, like any other rebounds, are a “good thing.” Well, they are great if you already missed the shots. But not better than if you didn’t miss the shots from the first place.
