This post is a sequel to my last post: Using Regular Season Matchup Records to Predict Winning Teams in the Playoffs. In that post, we used regular-season matchup records to predict which team will advance to the next round of the Playoffs, which logged about 71% accuracy.
In this post, we will introduce two additional methods for predicting team advancement in the Playoffs. We will see how these new methods fare against the original method that utilizes regular-season matchup records.
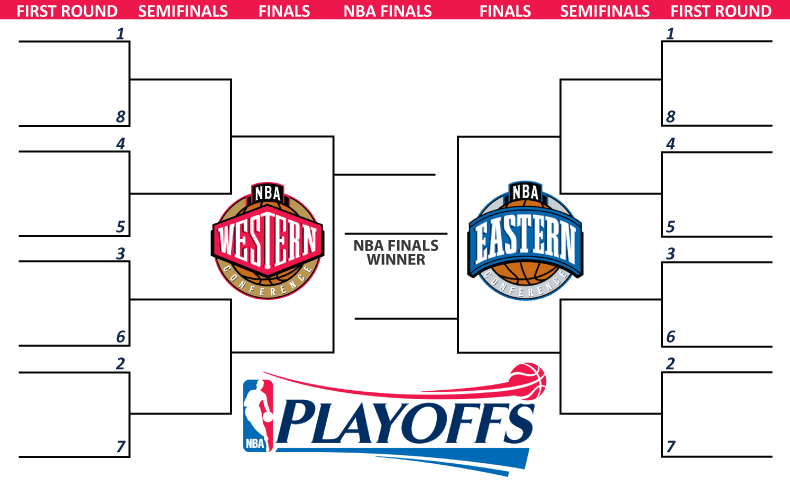
The first new method is the seed-based prediction. In the Playoffs, teams in each conference are placed in different seeds (1 through 8) based on their regular-season performance. NBA’s seeding arrangement is a complex process, but generally speaking, Seed 1 (highest seed) team has the best regular-season record in the conference, whereas Seed 8 (lowest seed) team has the worst regular-season record.
The following diagram shows how the matchups are arranged based on the seeding.

In the seed-based method, we utilize the following logic:
- If a team is of a higher seed, then predict that the team will advance to the next round.
- If a team is of a lower seed, then predict that the team will lose and not advance to the next round.
- In case of the NBA Finals, whichever team that hosts the first two games at home will win the series.
This seed-based method fared better than the original method of predicting based on regular-season matchup records. The overall accuracy of the seed-based method logged 75%, which is about 4% more than the regular-season-matchup-record method.
I wanted to see if I could increase the accuracy even further by combining the original regular-season-matchup-record method with the new seed-based method. The logic for the third method is as follows:
- If a team won more games against its opponent and was of a higher seed, then predict that it would win the series and advance to the next round of the Playoffs.
- If a team lost more games against its opponent and was of a lower seed, then predict that it would lose the series and NOT advance to the next round of the Playoffs.
- If a team doesn’t meet the above two conditions, then don’t make any prediction about which team will advance to the next round of the Playoffs and skip.
With this final method, I was able to boost the accuracy up to 81%.
| Accuracy of Method 1 (Regular-Season Matchup) |
Accuracy of Method 2 (Seed-Based) |
Accuracy of Method 3 (Combination) |
|---|---|---|
| 71% | 75% | 81% |
The year-over-year accuracies are as follows:
| Season | Accuracy of Method 1 (Regular-Season Matchup) |
Accuracy of Method 2 (Seed-Based) |
Accuracy of Method 3 (Combination) |
|---|---|---|---|
| 1979-80 | 86% (12-2-8) | 91% (20-2-0) | 100% (12-0-10) |
| 1980-81 | 62% (10-6-6) | 45% (10-12-0) | 60% (6-4-12) |
| 1981-82 | 56% (10-8-4) | 55% (12-10-0) | 60% (6-4-12) |
| 1982-83 | 75% (12-4-6) | 64% (14-8-0) | 83% (10-2-10) |
| 1983-84 | 40% (8-12-10) | 73% (22-8-0) | 57% (8-6-16) |
| 1984-85 | 78% (14-4-12) | 73% (22-8-0) | 88% (14-2-14) |
| 1985-86 | 92% (24-2-4) | 93% (28-2-0) | 92% (24-2-4) |
| 1986-87 | 64% (14-8-8) | 67% (20-10-0) | 67% (12-6-12) |
| 1987-88 | 100% (22-0-8) | 80% (24-6-0) | 100% (20-0-10) |
| 1988-89 | 67% (16-8-6) | 73% (22-8-0) | 78% (14-4-12) |
| 1989-90 | 82% (18-4-8) | 80% (24-6-0) | 80% (16-4-10) |
| 1990-91 | 78% (14-4-12) | 67% (20-10-0) | 88% (14-2-14) |
| 1991-92 | 64% (14-8-8) | 93% (28-2-0) | 88% (14-2-14) |
| 1992-93 | 60% (12-8-10) | 73% (22-8-0) | 75% (12-4-14) |
| 1993-94 | 73% (16-6-8) | 73% (22-8-0) | 88% (14-2-14) |
| 1994-95 | 67% (16-8-6) | 53% (16-14-0) | 60% (12-8-10) |
| 1995-96 | 77% (20-6-4) | 73% (22-8-0) | 75% (18-6-6) |
| 1996-97 | 60% (12-8-10) | 100% (30-0-0) | 100% (12-0-18) |
| 1997-98 | 55% (12-10-8) | 73% (22-8-0) | 67% (12-6-12) |
| 1998-99 | 50% (12-12-6) | 67% (20-10-0) | 62% (10-6-14) |
| 1999-00 | 50% (6-6-18) | 80% (24-6-0) | 60% (6-4-20) |
| 2000-01 | 78% (14-4-12) | 73% (22-8-0) | 100% (12-0-18) |
| 2001-02 | 70% (14-6-10) | 87% (26-4-0) | 100% (12-0-18) |
| 2002-03 | 50% (8-8-14) | 80% (24-6-0) | 80% (8-2-20) |
| 2003-04 | 67% (16-8-6) | 73% (22-8-0) | 78% (14-4-12) |
| 2004-05 | 100% (18-0-12) | 73% (22-8-0) | 100% (10-0-20) |
| 2005-06 | 58% (14-10-6) | 80% (24-6-0) | 78% (14-4-12) |
| 2006-07 | 75% (18-6-6) | 67% (20-10-0) | 86% (12-2-16) |
| 2007-08 | 88% (14-2-14) | 87% (26-4-0) | 100% (12-0-18) |
| 2008-09 | 92% (22-2-6) | 73% (22-8-0) | 100% (18-0-12) |
| 2009-10 | 67% (16-8-6) | 73% (22-8-0) | 73% (16-6-8) |
| 2010-11 | 69% (18-8-4) | 67% (20-10-0) | 78% (14-4-12) |
| 2011-12 | 64% (18-10-2) | 67% (20-10-0) | 78% (14-4-12) |
| 2012-13 | 70% (14-6-10) | 67% (20-10-0) | 71% (10-4-16) |
| 2013-14 | 62% (10-6-14) | 73% (22-8-0) | 80% (8-2-20) |
| 2014-15 | 82% (18-4-8) | 87% (26-4-0) | 82% (18-4-8) |
| 2015-16 | 69% (18-8-4) | 80% (24-6-0) | 82% (18-4-8) |
| 2016-17 | 82% (18-4-8) | 87% (26-4-0) | 89% (16-2-12) |
