
This post extracts the top 50 scoring seasons since 1981, the introduction of the 3-point line. This new mechanic undoubtedly changed the way players score, but how do the top scorers actually differ? You can view an interactive set of these plots here. It has mouseover effects, filtering, and highlighting effects containing more information about each player and season.

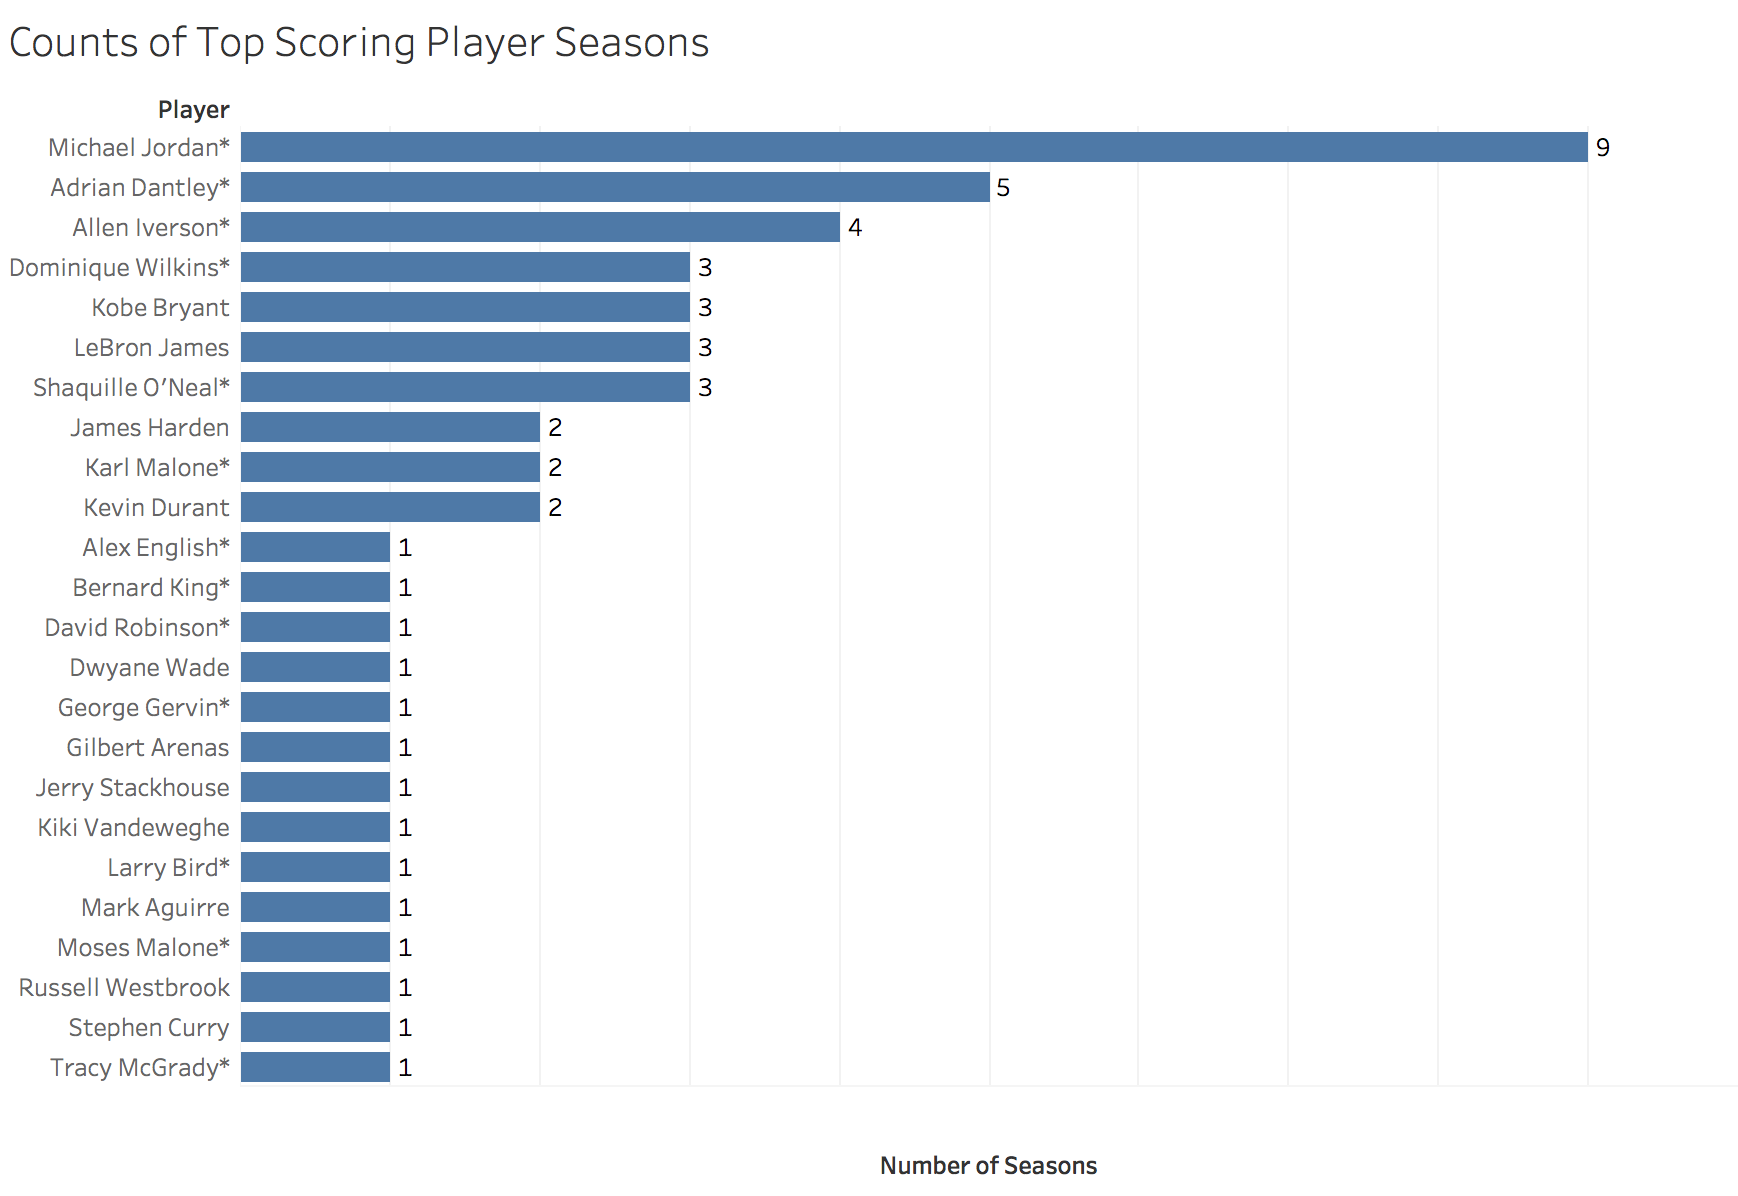
Looking at the counts of player entries, position, and time periods, we can see a few things:
- Michael Jordan is incredible.
- Adrian Dantley is a force too.
- The wing players score the most.
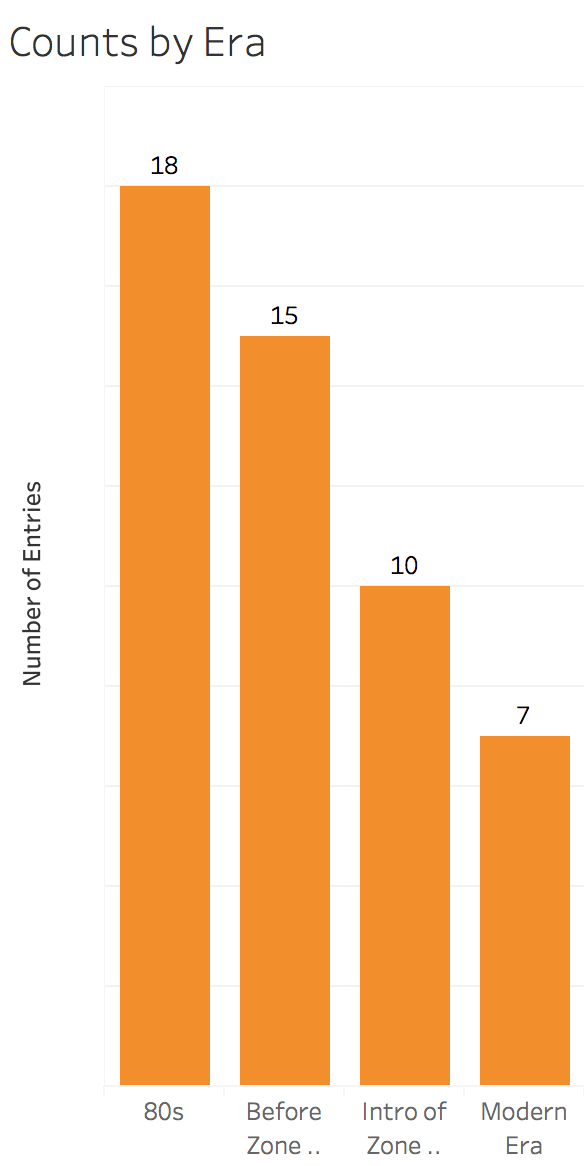
- Most of the high scoring seasons came earlier.

Things I note in this scatter plot:
- The giant Russell Westbrook entry, with nearly 42% usage rate.
- Adrian Dantley’s multiple entries have extremely low usage rates.
- Again, Michael Jordan is amazing.
- Although Allen Iverson has multiple entries, we can see his efficiency is low for the volume.


These two plots show how scoring has changed among the eras. In the modern era, players utilize every kind of mechanic to score. However, what could be extra impressive is how Michael Jordan didn’t shoot the most free throws or 3-pointers, he just scored on two point field goals. This also visualizes the scoring balance of a lot of modern players, particularly James Harden.
Notes:
- Eras are grouped as following:
- 80s: 1980 – 1989
- Before Zone Defense: 1990 – 2002
- Introduction of Zone Defense: 2003 – 2010
- Modern Era: 2011 – 2017
- A glossary of terms can be found here.
- Here is a definition of free-throw rate.
- Here is a definition of 3-point rate.
- An asterisk on a player’s name denotes a Hall of Fame player.
- Again, interactive forms of these plots can be viewed here.
